
Air quality indices like AQI, CAQI, and PSI help you understand pollution levels worldwide by simplifying complex data into easy-to-interpret numbers. AQI is commonly used in the U.S., while CAQI covers European countries, and PSI is popular in regions like Singapore. Each index translates pollutant concentrations into a single safety score, making health risks clearer. If you’re curious about how these indices compare and what they signal, you’ll find useful insights ahead.
Key Takeaways
- AQI, CAQI, and PSI are different indices used globally to communicate air quality levels effectively.
- AQI is primarily used in the U.S., while CAQI is common across Europe, and PSI is used in Singapore.
- All indices convert pollutant concentrations into a single number but may use different scales and thresholds.
- AQI ranges from 0 to 500, whereas CAQI and PSI have their own scales and safety level definitions.
- These indices help inform the public about health risks and guide policy decisions worldwide.
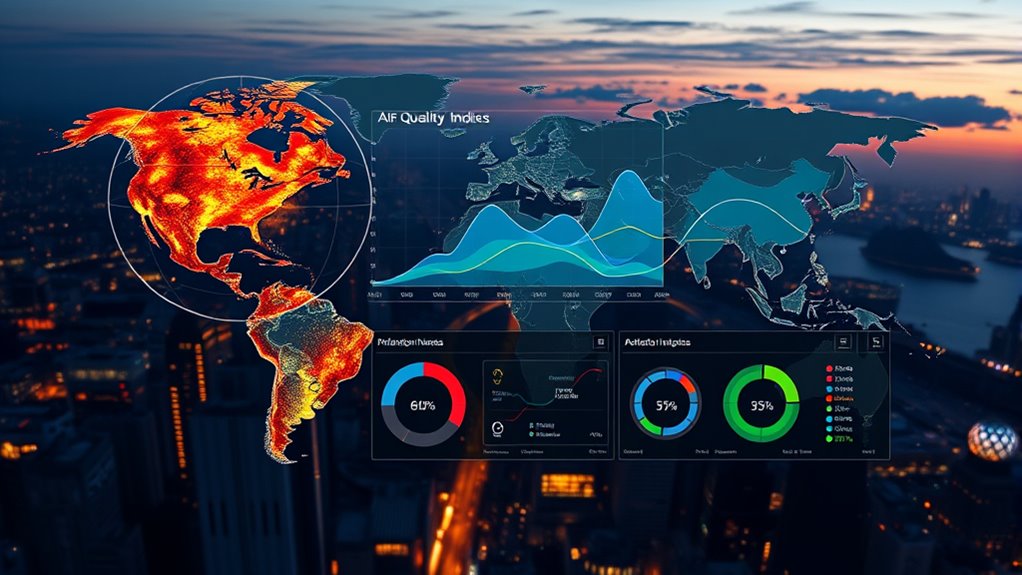
Have you ever wondered how governments and health organizations determine whether the air you breathe is safe? It all starts with understanding how they identify pollution levels through carefully measured data. To do this, they examine pollution sources—like vehicle emissions, industrial activities, and natural events such as wildfires—that contribute to air quality issues. Once these sources are known, experts use various measurement techniques to assess the concentration of pollutants in the air. These techniques include ground-based monitoring stations equipped with sensors that detect pollutants like particulate matter (PM), nitrogen dioxide (NO₂), sulfur dioxide (SO₂), ozone (O₃), and carbon monoxide (CO). Some countries also employ remote sensing technologies, such as satellites, to gather broader data on pollution distribution. These measurement techniques provide precise data, which form the basis for calculating air quality indices.
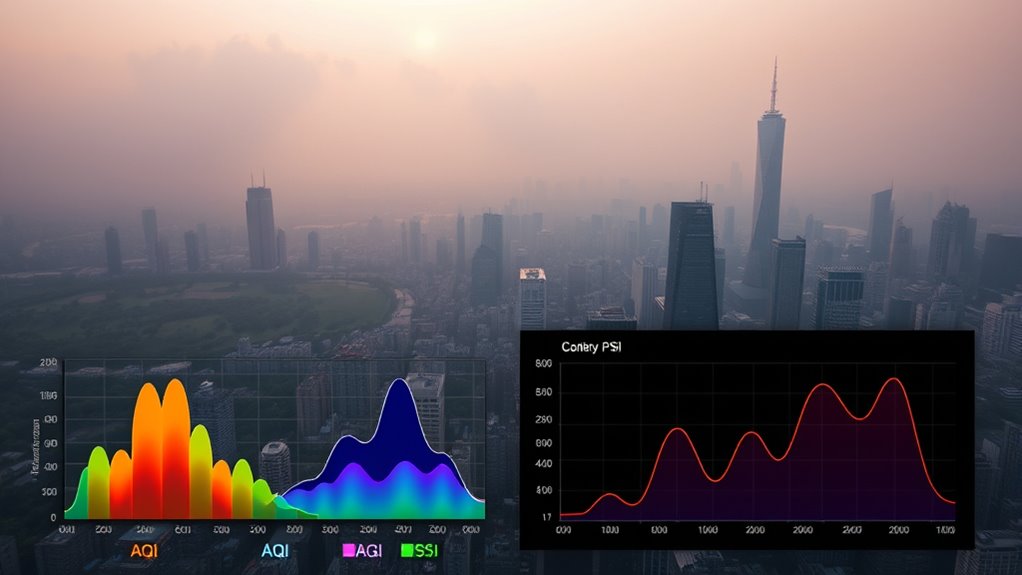
Once measurements are collected, the data are translated into an index that simplifies complex pollutant levels into a single, understandable number. Different regions use different indices, but the core idea remains the same: to give the public a clear picture of how safe or hazardous the air currently is. For example, the Air Quality Index (AQI), used in the United States and many other countries, converts pollutant concentrations into a scale from 0 to 500. Lower values mean cleaner air, while higher values indicate more dangerous conditions. Similarly, the Common Air Quality Index (CAQI) used across Europe consolidates measurements into a straightforward number that helps residents understand local air quality. The Pollutant Standards Index (PSI), used in some regions like Singapore, also transforms pollutant data into a single value that reflects safety levels.
These indices are essential because they translate technical measurements into accessible information for the public. They help you understand whether outdoor air poses health risks, especially for sensitive groups like children, the elderly, or those with respiratory conditions. Governments and health organizations continuously monitor pollution sources and refine measurement techniques to guarantee the data’s accuracy. This ongoing effort allows them to update air quality indices regularly, providing real-time insights into environmental health. When you see an air quality index number on a weather app or news broadcast, it’s the result of a complex process—collecting pollution source data, employing measurement techniques, and calculating an index that informs you about the safety of the air you breathe.
Frequently Asked Questions
How Do AQI, CAQI, and PSI Compare in Accuracy?
You’ll find that AQI, CAQI, and PSI vary in accuracy due to differences in sensor calibration and data comparability. AQI often uses standardized sensors, ensuring consistent results, while CAQI and PSI may rely on less calibrated sensors, affecting precision. To compare them accurately, verify sensors are well-calibrated and data collection methods are compatible. This way, you get a clearer picture of air quality across different indices.
Which Index Is Most Widely Used Worldwide?
Think of the AQI as a universal language spoken in many regions, making it the most widely used worldwide. Despite regional variations and efforts at index standardization, AQI remains the global standard for air quality reporting. Its widespread adoption simplifies understanding across borders, allowing people to compare air quality easily, regardless of where they are. So, you’ll find AQI most commonly used for real-time air quality updates across nations.
How Do Seasonal Changes Affect These Indices?
Seasonal fluctuations and weather patterns substantially impact air quality indices like AQI, CAQI, and PSI. During winter, colder temperatures and stagnant air can trap pollutants, causing higher index values. Conversely, in summer, increased wind and sunlight help disperse pollutants, lowering the indices. You’ll notice these seasonal changes influencing the readings, so it’s essential to take into account weather patterns when evaluating air quality throughout the year.
Can Individual Health Conditions Influence AQI Interpretation?
Did you know that individuals with personal health issues, especially vulnerable groups like children and the elderly, should interpret AQI with extra caution? Your personal health conditions can make you more sensitive to pollution levels, meaning a moderate AQI might pose a serious risk for you. Always consider your health status when evaluating air quality; what’s safe for others might not be safe for you. Stay informed and protect yourself accordingly.
Are There Real-Time Apps Tracking All Three Indices Simultaneously?
Yes, there are real-time apps that track all three indices—AQI, CAQI, and PSI—simultaneously. These apps use air quality monitoring data from various sources to compare the indices, helping you understand pollution levels worldwide. By providing real-time updates and detailed index comparisons, they enable you to make informed decisions about outdoor activities and health precautions. You can easily access these tools on smartphones for on-the-go air quality information.
Conclusion
Now that you’ve seen how AQI, CAQI, and PSI measure air quality differently, remember—these indices are the compass guiding your health choices. Think of them as the canaries in the coal mine, alerting you before danger strikes. Don’t ignore the signs; stay informed, stay safe. Because in the battle between pollution and protection, awareness is your ultimate shield—your silent hero in the fight for breathable air.