To guarantee accurate air quality mapping, carefully select sensor locations by avoiding areas with direct sunlight, strong winds, or local pollution sources. Elevate sensors and position them where airflow is sufficient to prevent obstructions. Regular calibration—both in labs and in the field—helps maintain measurement accuracy over time. Combining data from multiple sites and employing spatial analysis improves coverage and reliability. Keep adjusting your placement strategies regularly, and you’ll uncover more ways to refine your air quality insights.
Key Takeaways
- Strategically position sensors to maximize coverage of high-traffic and pollution-prone areas for comprehensive mapping.
- Elevate sensors above ground level and avoid direct sunlight and wind interference to ensure accurate measurements.
- Regularly calibrate sensors using laboratory standards and field checks to maintain data precision over time.
- Integrate data from multiple sensors with GIS tools to identify spatial patterns and optimize placement.
- Continuously refine sensor deployment based on environmental changes and stakeholder feedback for improved accuracy.

Effective sensor placement is fundamental for maximizing data accuracy and system efficiency. When deploying air quality sensors, your goal is to capture reliable, representative data that reflects real-world conditions. To do this, you need to consider calibration techniques carefully. Proper calibration ensures that each sensor provides precise measurements over time. Regular calibration, whether through laboratory standards or field calibration methods, helps account for sensor drift and environmental factors affecting sensor response. By establishing a robust calibration routine, you reduce measurement errors and improve the consistency of your data. Additionally, calibration techniques should be tailored to the specific pollutants you’re monitoring, ensuring that sensors respond accurately to varying concentrations.
Beyond calibration, data integration methods play an essential role in optimizing sensor deployment. These methods involve combining data from multiple sensors strategically placed across the area of interest. When integrating data effectively, you can identify patterns, fill gaps in coverage, and cross-verify measurements for accuracy. Spatial data analysis allows you to pinpoint ideal sensor locations, avoiding redundant placement and ensuring coverage in areas with high traffic, industrial activity, or vulnerable populations. Data integration techniques also include processing algorithms that filter out noise and correct for sensor biases, further improving the reliability of your air quality maps. Utilizing Geographic Information Systems (GIS) and other spatial analytics tools helps you visualize data in real time, guiding adjustments to sensor placement as conditions change.
It’s essential to think about the environment when planning sensor locations. Place sensors away from sources of interference like direct sunlight, strong winds, or pollution sources that could skew readings. Elevate sensors to avoid ground-level obstructions and ensure airflow around them, which helps avoid stagnant readings. When considering calibration and data integration, remember that sensors need to be positioned in areas that provide representative data without being overly influenced by localized anomalies. Regularly updating your data integration methods ensures that your system adapts to new patterns or changes in environmental conditions. This continuous refinement supports more accurate air quality maps and better decision-making. Incorporating powerful persuasive words into your communication can further enhance stakeholder engagement and support for your monitoring initiatives.
Ultimately, combining meticulous calibration techniques with intelligent data integration methods creates a resilient framework for sensor placement. This approach guarantees that your air quality monitoring system delivers precise, actionable data. By focusing on these strategies, you can optimize sensor deployment, improve data quality, and develop comprehensive air quality maps that truly reflect the environment’s state. Proper sensor placement isn’t just about where to put sensors; it’s about creating a reliable, adaptive system that provides consistent, high-quality data to inform policy, health advisories, and environmental management.
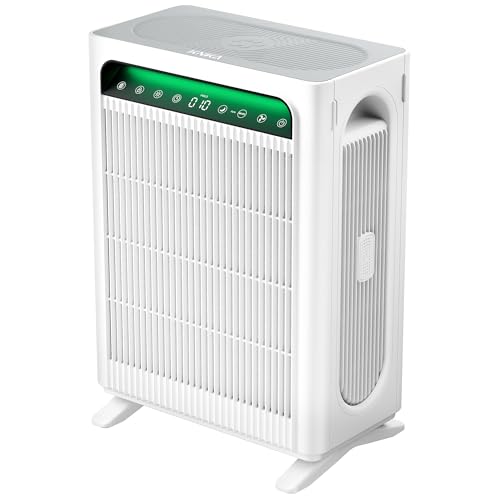
KNKA Air Purifier for Home Bedroom Large Room Up to 1,695 Ft² in 1 Hr, HEPA Sleep Mode Air Cleaner with Washable Pre-Filter, AHAM VERIFIDE, AQI Display, Pet Mode for Pets, Dust, Pollen, APH4000
𝐀𝐇𝐀𝐌 𝐕𝐞𝐫𝐢𝐟𝐢𝐞𝐝 & 𝐇𝐢𝐠𝐡 𝐂𝐀𝐃𝐑 𝐕𝐚𝐥𝐮𝐞: Certified by the Association of Home Appliance Manufacturers, this air purifier provides...
As an affiliate, we earn on qualifying purchases.
Frequently Asked Questions
How Does Weather Variability Affect Sensor Placement Effectiveness?
Weather influence notably affects sensor placement effectiveness because humidity, wind, and temperature variations can skew readings. You need to take into account these factors to ensure accurate data collection. Regular sensor calibration helps counteract weather variability’s impact, maintaining reliability. By strategically placing sensors in sheltered, consistent environments and adjusting for weather conditions, you improve mapping accuracy, ensuring your air quality data truly reflects real-time conditions regardless of weather fluctuations.
What Is the Ideal Sensor Density for Urban Air Quality Mapping?
You should aim for a sensor density of at least one sensor per 250 to 500 meters in urban mapping, depending on the area’s complexity. Higher sensor density improves data accuracy and captures local variations better. By increasing sensor density, you guarantee more precise air quality mapping, helping you identify pollution hotspots and trends. Adjust your sensor placement based on traffic, industrial zones, and population density for ideal results.
How Can Sensor Placement Adapt to Changing Pollution Sources?
You can’t ignore the fact that pollution sources change over time, so you need dynamic placement to keep sensors effective. By regularly analyzing pollution patterns, you adapt sensor locations to address new or shifting sources. This source adaptability guarantees your air quality data remains accurate and relevant, allowing you to respond swiftly to emerging issues. Embracing a flexible approach ensures your mapping stays precise, no matter how pollution sources evolve.
What Role Do Topographical Features Play in Sensor Deployment?
You should consider topographical features because terrain obstacles and elevation influence pollutant dispersion. Elevated areas often require sensors placed higher up to capture air quality accurately, while valleys and low-lying regions may trap pollutants, needing closer monitoring. By understanding how elevation influences air movement, you can optimize sensor placement to guarantee thorough coverage and reliable data, adapting to natural landscape variations for precise air quality mapping.
How Can Community Input Improve Sensor Network Accuracy?
You can improve sensor network accuracy through community engagement by gathering local insights on pollution sources and air quality patterns. Encouraging community members to share observations helps validate the data collected, ensuring sensors are placed effectively. Their input highlights real-world conditions that might otherwise be overlooked, leading to better data validation. This collaborative approach enhances the overall reliability of air quality maps, making them more relevant and actionable for everyone involved.

Air Purifiers for Home Large Room, Cover Up to 2600 Ft² with Washable Filters, Powerful Turbo Mode, PM2.5 Air Quality Display, Air Cleaner for Pets, HAP607, Bright White
𝐓𝐑𝐈𝐏𝐋𝐄 𝐈𝐍𝐓𝐀𝐊𝐄, 𝐖𝐇𝐎𝐋𝐄-𝐑𝐎𝐎𝐌 𝐏𝐔𝐑𝐈𝐅𝐈𝐂𝐀𝐓𝐈𝐎𝐍: Featuring a front air inlet combined with wider dual-side air inlets, this air purifier...
As an affiliate, we earn on qualifying purchases.
Conclusion
By choosing ideal sensor placement strategies, you can greatly improve air quality mapping accuracy. Did you know that strategically positioned sensors can reduce measurement errors by up to 40%? This highlights how careful placement isn’t just about coverage but about capturing precise data. Implementing these strategies ensures you get reliable insights into air pollution levels, helping you make informed decisions for healthier communities. So, prioritize smart placement—you’ll see the difference in your data quality.
BLUEAIR Air Purifiers for Large Rooms, Cleans 3,048 Sqft In One Hour, HEPASilent Smart Air Cleaner For Home, Pets, Allergies, Virus, Dust, Mold, Smoke - Blue Pure 211i Max
BLUEAIR’S TOP-PERFORMING AIR PURIFIER LINE: Blue family’s new Pure Max series with our proprietary HEPASilent performance now even...
As an affiliate, we earn on qualifying purchases.

LEVOIT Air Purifiers for Home Large Room Up to 1875 Ft² with Washable Pre-Filter, AHAM VERIFIDE, Air Quality Monitor, HEPA Sleep Mode for Allergies, Pet Hair in Bedroom, Vital 200S-P, White
𝐖𝐇𝐘 𝐂𝐇𝐎𝐎𝐒𝐄 𝐀𝐇𝐀𝐌 𝐕𝐄𝐑𝐈𝐅𝐈𝐃𝐄 𝐏𝐑𝐎𝐃𝐔𝐂𝐓𝐒: AHAM (Association of Home Appliance Manufacturers) is an ANSI-accredited organization that sets strict...
As an affiliate, we earn on qualifying purchases.